Where the Reviewers Disagree, and by How Much
We hold 77 outlet scores across 24 products. Nearly half of them span two points or more — and the scale itself explains a lot of that.
If you buy through our links, we may earn a commission. It never affects our verdicts or scores — how that works. As an Amazon Associate I earn from qualifying purchases.
Reviewers agree less than an average makes them look. We hold 77 published scores across 24 products, and on a typical one the harshest and kindest outlet are 1.5 points apart on a ten-point scale. Eleven of the 24 span two points or more.
That matters because our shortlists print a single averaged number, and a single number hides whether it came from three people nodding along or two arguing. So here is the argument, from our own data.
The scale is doing a lot of the work
Before reading anything into those two-point gaps: most of them are one outlet giving four stars where another gave five. On a five-star scale, half a star is a whole point out of ten and one star is two. Seven of the eleven widest spreads land on exactly 2.0, which is the number a single step of disagreement produces.
That is a much smaller argument than “two points apart” sounds. It also means a five-star scale cannot express a small disagreement at all — the reviewer either matches or jumps a full point in our terms. Anyone averaging star ratings, us included, is working with a blunt instrument and should say so.
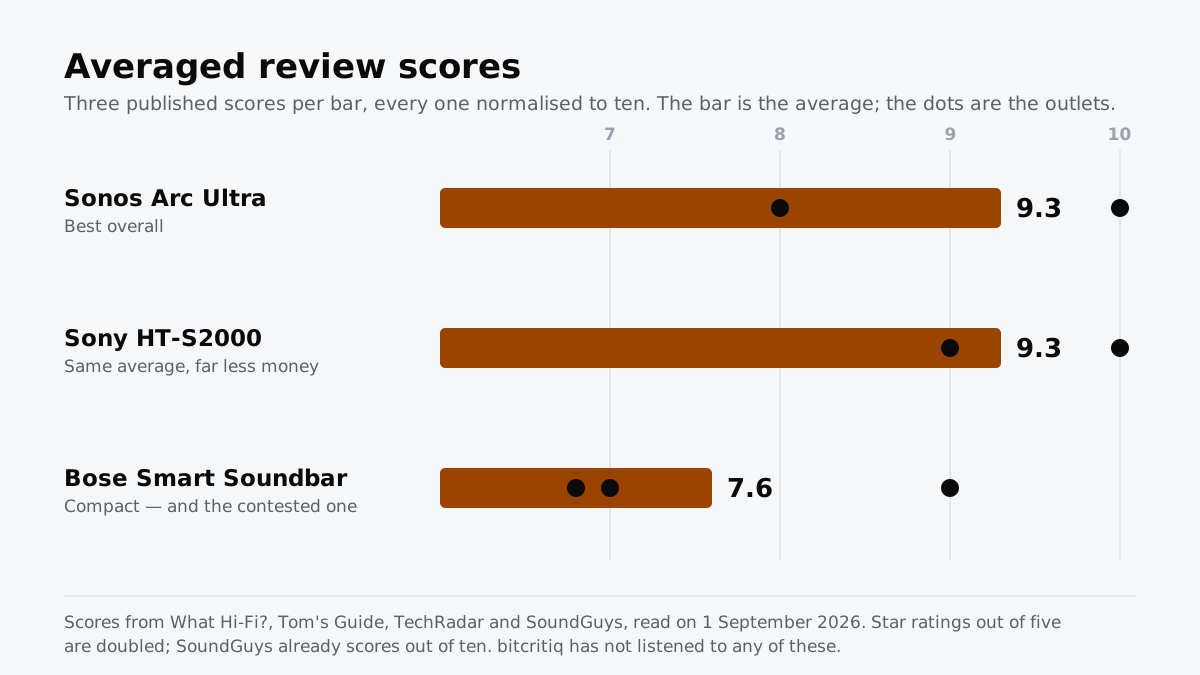
The genuine outlier survives that correction. The Bose Smart Soundbar spans 2.2 points, and it gets there differently: SoundGuys scored it 6.8 out of ten, a number a star scale cannot produce, against TechRadar’s 4.5 out of 5. Both low scorers named the same two faults — thin bass, narrow soundstage — so that one is a real disagreement about what the product is for.
Outlets have house styles, and they are small
For every product with three or more scores, each outlet’s distance from the others reviewing the same thing was computed the same way. The pattern is consistent and modest.
| Outlet | Scores | Distance from the room |
|---|---|---|
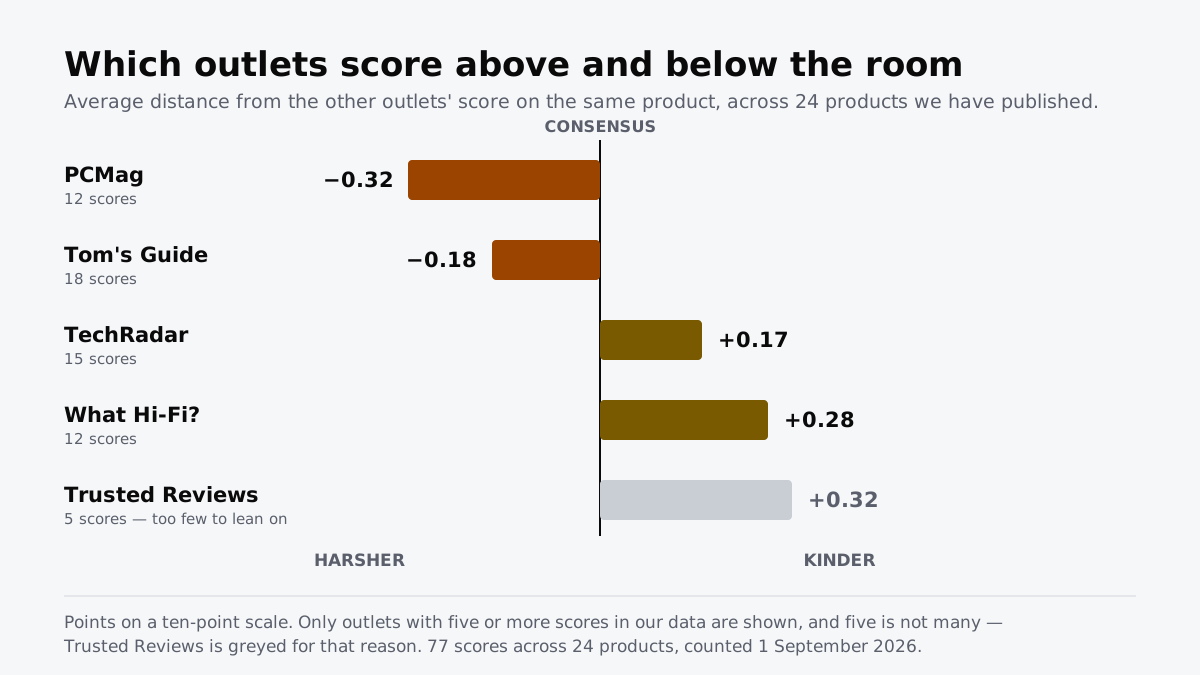
| PCMag | 12 | −0.32 |
| Tom’s Guide | 18 | −0.18 |
| TechRadar | 15 | +0.17 |
| What Hi-Fi? | 12 | +0.28 |
About six-tenths of a point separates the harshest house from the kindest. That is smaller than most people assume and larger than nothing: it is roughly the difference between an 8.7 and a 9.3, which is the difference between second and first place on one of our lists.
Trusted Reviews came out kindest of all at +0.32, on five scores. Five is not enough to say anything, which is why it is greyed out in the chart rather than in the table.
What we are not claiming
Harsher is not better. An outlet sitting below the room may be tougher, or may review at a different price point, or may have had a worse unit. We cannot see which, and neither can you — a spread tells you an argument exists, not who won it.
The sample is also ours, which is a real limitation: these are products that made our shortlists, so they are mostly good hardware scoring in a narrow band near the top. A wider sample including bad products would probably show wider disagreement, not narrower.
How to read any shortlist, including ours
- Look for the spread, not just the average. An 8.5 from three outlets who all said 8.5 is a different fact from an 8.5 built out of a 7 and a 10.
- Treat a one-star gap as a small disagreement, because on a five-point scale it is the smallest one available.
- Take a score below 7 from an outlet that scores out of ten seriously. Those scales can express mild disappointment; star scales mostly cannot.
- Two agreeing outlets is a coincidence you can defend; three is a pattern. That is the threshold our shortlists use, and this data is the reason it is set where it is.
Every number here comes from scores we have already published with their sources attached, so you can check the arithmetic on any of them. That is the point of showing the working rather than the conclusion.
How we researched this
No one at bitcritiq has handled this product. Everything here comes from published sources, listed below.
- What this cannot tell you
- Twenty-four products is a small sample and five scores is a very small one, so the per-outlet numbers are a tendency and not a rating. The products are not randomly chosen — they are the ones that made our shortlists, which skews toward well-reviewed hardware and compresses the range. We cannot see whether an outlet reviewed a different production unit, a different configuration, or at a different price, and any of those would explain a gap without either reviewer being wrong.
How we chose this, and what we did
- Why this subject
- Our shortlists average published scores from named outlets, which means we have been quietly accumulating a dataset about the outlets themselves. Nobody publishes that, so we did. This is our own data, about our own method, and the finding cuts against us as much as for us.
- How we looked at it
- Every consensus score bitcritiq has published was collected — 77 scores, 24 products, 16 outlets — and normalised each to a ten-point scale. For each product with three or more scores, computed the spread between the highest and lowest. For each outlet, computed its mean signed distance from the average of the other outlets scoring the same product on the same day. Outlets with fewer than five scores are excluded as too thin to say anything about.
What this rests on
Each claim below, and how firmly it is held. Nothing here was measured by bitcritiq — see how we test for why.
Across 24 products with three or more published scores, the median spread between the highest and lowest outlet is 1.5 points on a ten-point scale.
Eleven of those 24 products span two points or more between their harshest and kindest outlet.
A single step of disagreement on a five-star scale appears as a two-point gap once normalised to ten, which accounts for most of the two-point spreads.
PCMag scores 0.32 points below the other outlets on the same product on average, and What Hi-Fi? 0.28 above — a gap of about 0.6 points between the two house styles.
Sources 6
- Bose Smart Soundbar review — SoundGuysaccessed Sep 1, 2026
- Bose Smart Soundbar review — TechRadaraccessed Sep 1, 2026
- Bose Smart Soundbar review — Tom's Guideaccessed Sep 1, 2026
- Sonos Roam 2 review — What Hi-Fi?accessed Sep 1, 2026
Show 2 more
- Sonos Arc Ultra review — TechRadaraccessed Sep 1, 2026
- Sonos Arc Ultra review — What Hi-Fi?accessed Sep 1, 2026
Follow bitcritiq
New articles, no email address, no account. Subscribe by RSS in any reader.
Using Chrome on Android? Open the browser menu and tap Follow. New articles then turn up in the Following tab in Discover.
read next
The Best Soundbars, According to the Reviews

The Best Portable Speakers, According to the Reviews

The Best TVs of 2026, According to the Reviews
