Does Paying More Get You a Better Product?
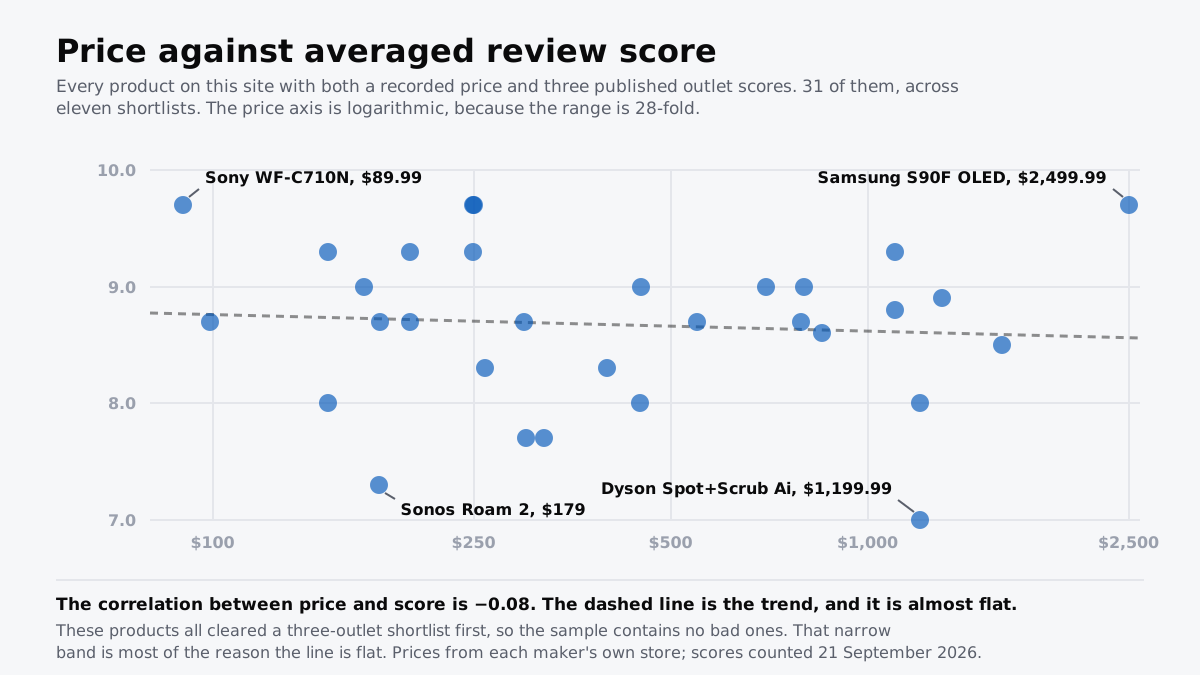
Across the 31 products we hold with both a price and three outlet scores, the correlation between them is −0.08.
If you buy through our links, we may earn a commission. It never affects our verdicts or scores — how that works. As an Amazon Associate I earn from qualifying purchases.
Update, 21 September 2026. The robot vacuum and TV shortlists were re-read on 21 September, and five of the averages this page uses moved: the Roborock Saros 20 from 9.0 to 8.5, the Roborock Qrevo Curv from 8.7 to 8.6, the Dyson Spot+Scrub Ai from 7.3 to 7.0, the Samsung S90F from 9.3 to 9.7 and the Hisense U8N from 8.0 to 8.8. Recomputed, the correlation is −0.08 rather than −0.10 and the slope −0.14 rather than −0.18; a price re-sourced on 5 September had already moved those to −0.09 and −0.16 without this page being updated. Two conclusions changed. The cheapest and dearest products now score the same, where the dearer one used to score lower. And robot vacuums are no longer a clean counterexample: the budget-to-flagship gap there shrank from 1.3 points to 0.8, and the $1,599.99 Saros 20 now averages below the $849.99 Qrevo Curv. We also said the 31 products spanned twelve categories; they come from eleven shortlists.
Among things already worth buying, paying more does not get you a better-reviewed one. We hold 31 products with both a recorded price and three published outlet scores. The correlation between what they cost and what they scored is −0.08, which is to say there is essentially none, and what little there is points the wrong way.
The fitted line puts it in money: ten times the price is associated with about a seventh of a point lower. The cheapest product in the set, the $89.99 Sony WF-C710N, averages 9.7. The most expensive, the $2,499.99 Samsung S90F OLED, averages 9.7 too: twenty-eight times the price, the same score.
Read the limitation first, because it is doing real work
This page describes a sample of products that already passed a filter. Every one of them reached a bitcritiq shortlist, which requires three named outlets to have published a numeric score for the same model. Not one of the 31 averages below seven out of ten.
Within a band that narrow, no variable predicts much, and price is no exception. So this is not evidence that price and quality are unrelated in general. A sample containing genuinely poor products would almost certainly show a relationship, because very cheap tech is often very bad tech and the reviews say so.
What the sample does describe is the situation an actual buyer is in: standing in front of several options that are all defensible, deciding how much to spend. In that situation, and on this evidence, the extra money is not buying a better verdict from the people who tested both.
The numbers, and what they are made of
| Products with a price and three scores | 31 |
| Shortlists they come from | 11 |
| Price range | $89.99 to $2,499.99, a factor of 28 |
| Score range | 7.0 to 9.7, a span of 2.7 points |
| Correlation, price against score | −0.08 |
| Slope | −0.14 points per tenfold price rise |
The price axis on the chart is logarithmic on purpose. On a linear axis every product under $500 collapses into a smear against the one $2,500 television, and two thirds of the data becomes unreadable.
Where the money does show up
Two places, and neither of them is the score.
Robot vacuums are the nearest thing to a counterexample, and a partial one. The $1,599.99 Roborock Saros 20 averages 8.5; the $299.99 Roborock Q7 M5 averages 7.7. That 0.8-point gap is the widest budget-to-flagship gap we hold, two and a half times the next, and all three outlets that scored the Q7 M5 mark down its mopping. But price does not sort the rest of that list: the $849.99 Qrevo Curv averages 8.6, above the Saros 20, and the $1,199.99 Dyson Spot+Scrub Ai averages 7.0, below the budget machine. Within Roborock’s range the dearer machines score higher; across brands, on this shortlist, price does not predict the score.
And an averaged score flattens what you actually pay for. When the $149.95 JBL Flip 7 draws level with the $199.95 JBL Charge 6, that is not a claim they are the same speaker; the dearer one has ten more hours of battery. When the cheap earbuds tie the expensive ones, the reviewers were scoring each against what it costs, which our earbud shortlist works through at length. Everything the extra money buys still exists. It has simply stopped showing up in the number most buying guides lead with.
What to actually do with this
- Set the budget first, then read the scores inside it. Choosing the price bracket is the decision that matters; within one, the scores will not sort themselves by cost.
- Ask what the premium buys that a score cannot show. Battery, expandability, a longer support window, a system you can add to. Those are real and they are invisible here.
- In a young category, compare what each machine is marked down for. Among robot vacuums the budget pick trails both Roborocks above it, on mopping, but the second-dearest machine on the list averages lowest of all.
- Check the list price before the percentage. Our audit of every superseded pick found that four of six successors cost more than the model they replace, and none cost less.
How we researched this
No one at bitcritiq has handled this product. Everything here comes from published sources, listed below.
- What this cannot tell you
- The sample is the whole problem, and it is worth reading before the finding. These are products that cleared a three-outlet consensus to reach one of our shortlists, so there is nothing bad in the set: scores run from 7.0 to 9.7 and not one product is below seven. Within a band that narrow, no variable predicts much. This page therefore cannot tell you that price is unrelated to quality in the market as a whole; a sample including genuinely poor products would almost certainly show otherwise. What it can tell you is what happens among options already worth considering, which is the choice an actual buyer is making. Prices are each maker's own figure, read on the date recorded against each product, and four of our top picks carry no price at all for reasons set out on their own pages.
How we chose this, and what we did
- Why this subject
- Our shortlists average published outlet scores, and our product records carry prices with the date each was read. Nobody set out to build a dataset relating the two, but twelve shortlists later there is one, and the question it answers is the one every buyer asks in a sale season. This page is that dataset, and the limitation in it is stated as prominently as the finding.
- How we looked at it
- Took every product on the site carrying both a price in its product record and three or more published outlet scores. Prices are each seller's own figure, read from the maker rather than from a retailer. Normalised each score to a ten-point scale and averaged it per product, giving 31 products across eleven shortlists. Fitted score against the base-ten logarithm of price, because prices in this set span 28-fold and a linear axis would compress everything below $500 into a smear. Reported the Pearson correlation and the slope of that fit, both computed on the unrounded averages. Every input is published on this site with its source attached, and the arithmetic is reproducible with scripts/consensus-stats.mjs in the site repository. Recomputed 21 September 2026 after the robot vacuum and TV shortlists were re-read.
What this rests on
6 claims, all corroborated. Nothing here was measured by bitcritiq — see how we test for why. Open a claim to read the source it came from.
Across 31 products carrying both a recorded price and three published outlet scores, the correlation between price and averaged score is −0.08.Corroborated
Pearson correlation of averaged score against the base-ten logarithm of price, computed from the consensus blocks and product records published on this site, recomputed 21 September 2026.
The fitted slope is −0.14 points per tenfold increase in price.Corroborated
Least-squares fit of averaged score against log price across the same 31 products. Ten times the money is associated with about a seventh of a point, in the wrong direction.
The cheapest product in the set scores the same as the most expensive one.Corroborated
Sony WF-C710N, $89.99, averages 9.7 from three outlets. Samsung S90F OLED, $2,499.99, averages 9.7 from three outlets.
Prices in the set span 28-fold while scores span 2.7 points on a ten-point scale.Corroborated
$89.99 to $2,499.99 is a factor of 27.8. The lowest average is 7.0, the Dyson Spot+Scrub Ai's; the highest is 9.7.
Every product in this set had already cleared a three-outlet shortlist, so the sample contains no poorly reviewed products at all.Corroborated
Not one of the 31 averages below 7.0; the lowest sits exactly on it. That truncation is the main reason the trend line is flat, and it means this page describes options already worth considering rather than the market as a whole.
Robot vacuums carry the widest budget-to-flagship gap we hold, but price does not order the machines on that shortlist either.Corroborated
The $1,599.99 Roborock Saros 20 averages 8.5 against 7.7 for the $299.99 Roborock Q7 M5, a gap of 0.8 points and two and a half times the next largest. The $1,199.99 Dyson Spot+Scrub Ai averages 7.0, below the Q7 M5.
Sources 6
- The Cheap One Wins Three Times Out of Four — bitcritiqaccessed Sep 4, 2026
- Where the Reviewers Disagree, and by How Much — bitcritiqaccessed Sep 4, 2026
- The Best Wireless Earbuds, According to the Reviews — bitcritiqaccessed Sep 4, 2026
- The Best Robot Vacuums, According to the Reviews — bitcritiqaccessed Sep 21, 2026
Show 2 more
- The Best TVs of 2026, According to the Reviews — bitcritiqaccessed Sep 21, 2026
- When a Newer Model Is Not the Better Buy — bitcritiqaccessed Sep 4, 2026
No email, no account
Follow bitcritiq
Every new article, in whatever reader you already use.
Subscribe by RSSAll the ways to follow
Using Chrome on Android? Open the browser menu and tap Follow. New articles then turn up in the Following tab in Discover.
read next
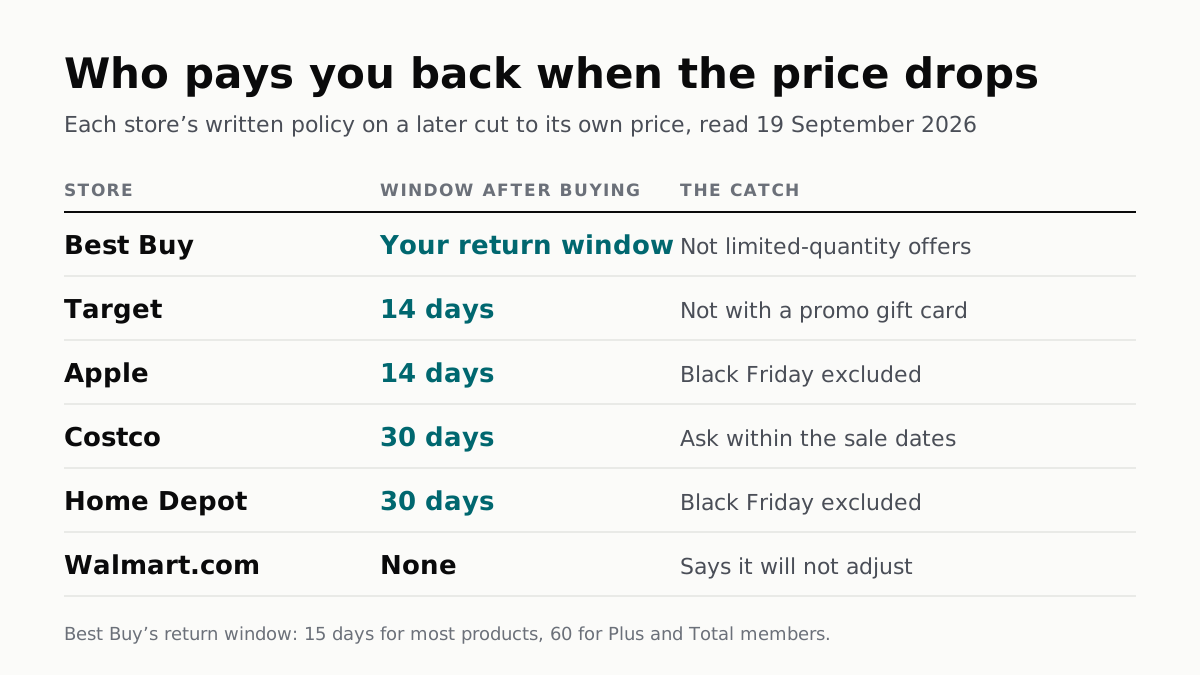
Five Stores Pay Back a Price Drop. Walmart.com Does Not
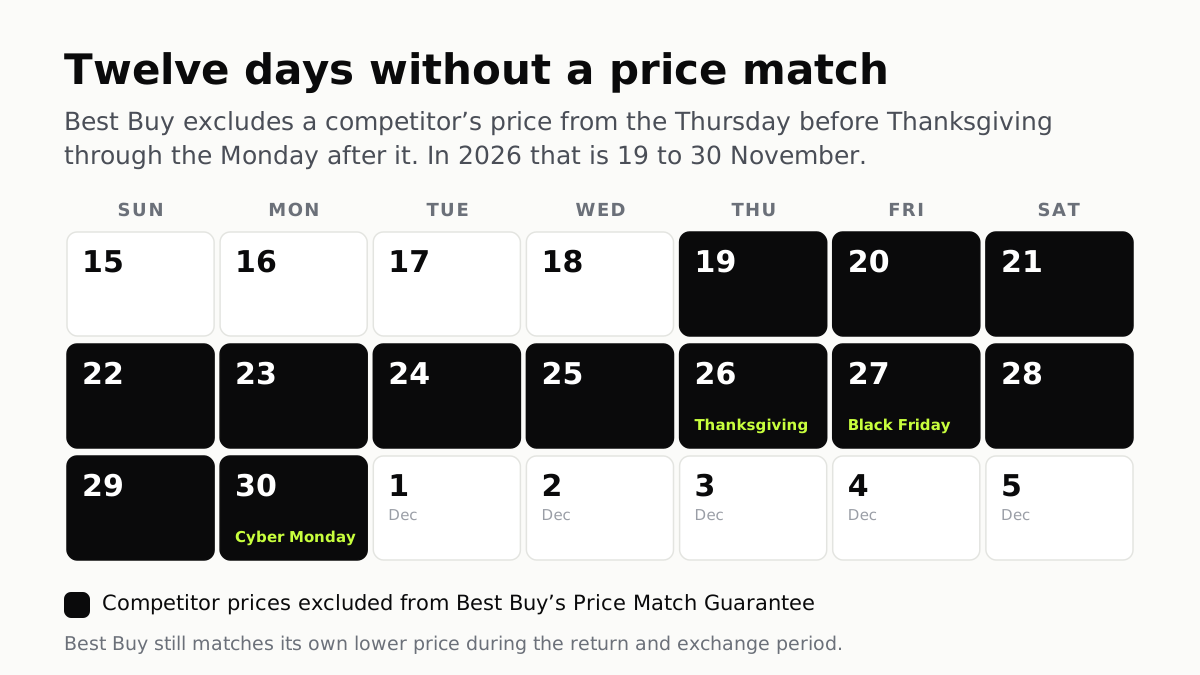
Best Buy's Price Match Is Off for Twelve Days
What a Crossed-Out Price Has to Have Been